
Sector Map
The sector map is used to display areas beyond normal visibility and to interact with them. You can set a flight path in it similarly to the basic view.
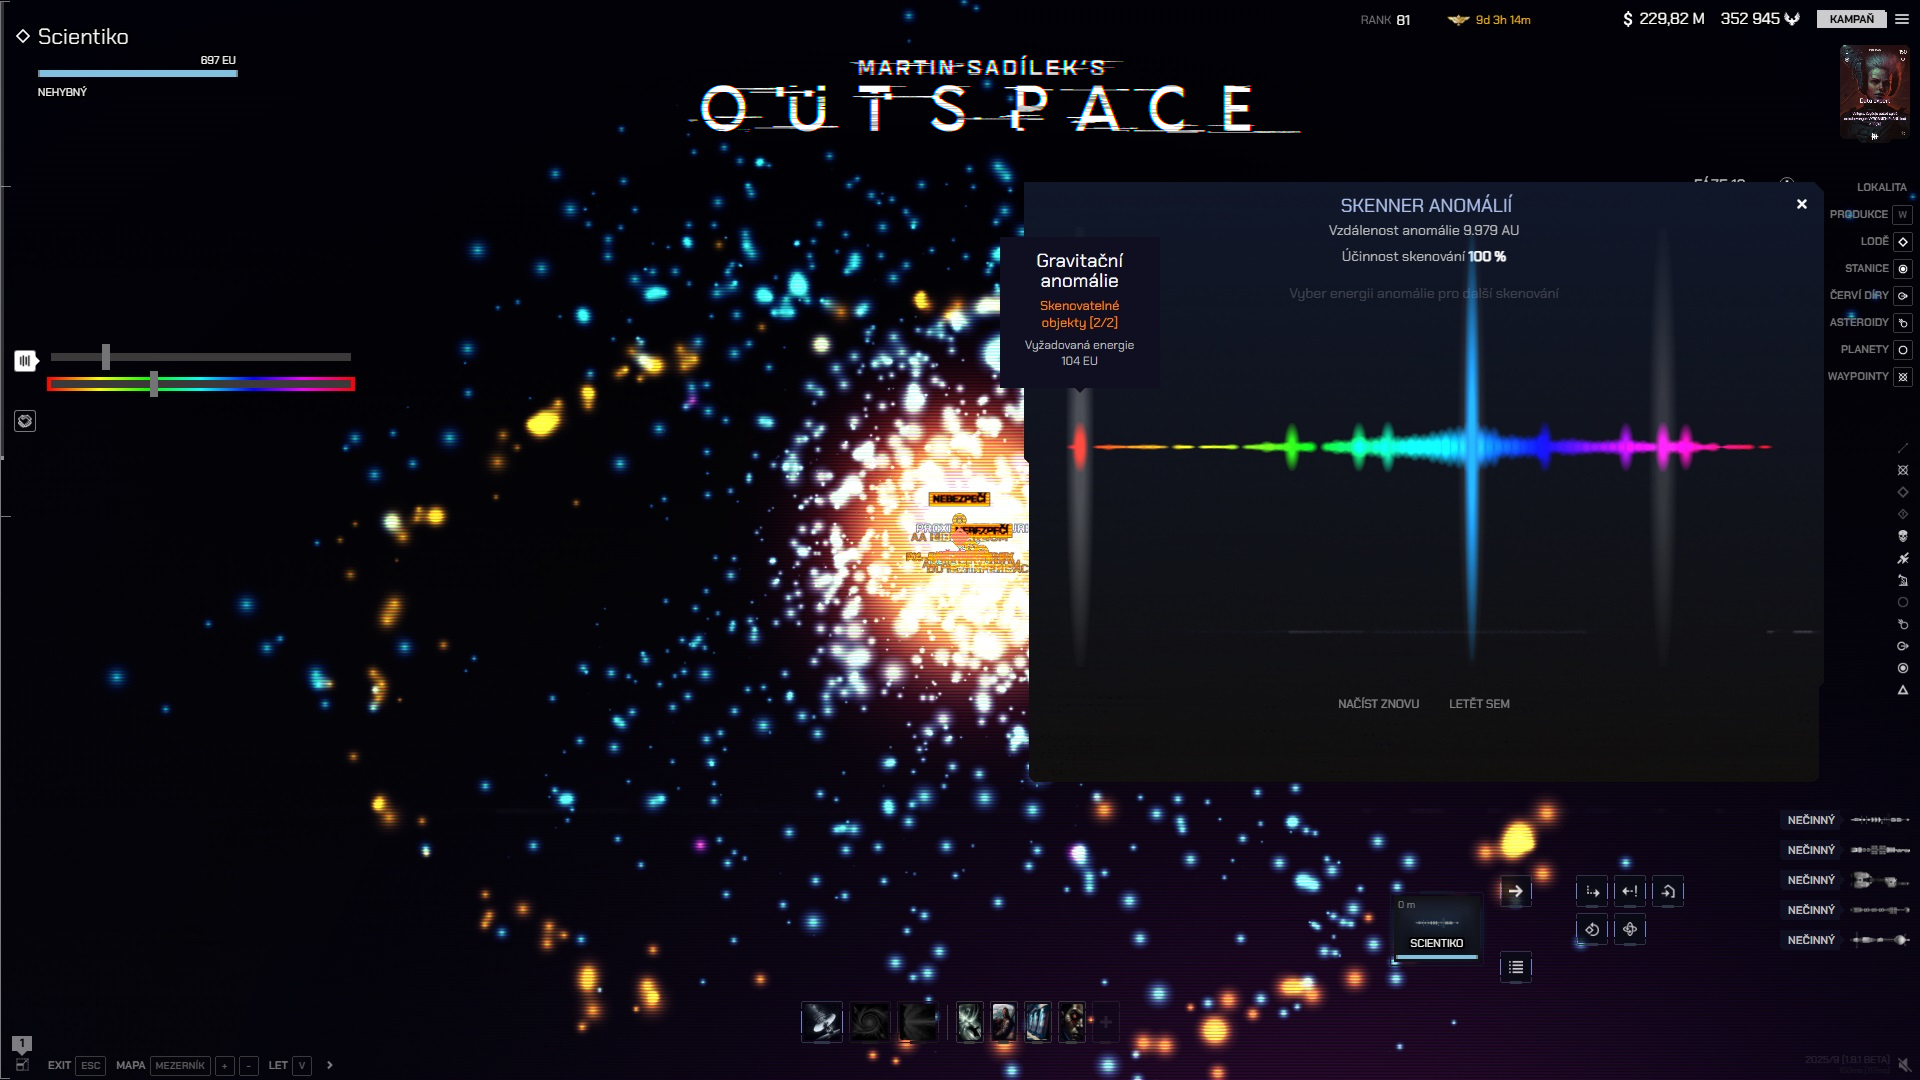 Sector map with the anomaly filter open.
Orientation
The map allows you to search for and filter objects. On the left side, you can find options for displaying trade filters, the life energy emission filter, and known infection destinations. You can also detect fragments here.
Display and interaction with objects
Visibility
The map displays publicly visible objects, objects the player is authorized to see, and objects detected by their own ships.
Filters
Anomalies

Anomalies represent a collection of traces left by objects in space. Every object leaves a signature, which is interpreted as an anomaly. Based on the spectrum of this trace, the origin can be estimated.
Using the spectrum slider, you can highlight or suppress individual types of signals. The spectrum is not sharply defined, so signals may overlap. The intensity slider allows you to adjust the brightness of points for better distinction.
In general, the larger the point, the stronger the signal source. The brighter the color, the more signal sources are present in that location.
Trade Offers

The trade filter allows you to display locations offering specific commodities. After enabling the filter, simply select the type and the specific commodity. The map will highlight points corresponding to the broadcast location of the offer. The slider can be used to adjust their intensity.
In general, the larger the point, the greater the volume of the offer. The brighter the color, the more offers are concentrated in that location.
Buyouts

The buyout filter allows you to display places where specific offers are automatically purchased, including the conditions that must be met for a buyout. After enabling the filter, simply select the type and the specific commodity. The map will highlight points corresponding to the broadcast location of the offer. The slider can be used to adjust their intensity.
In general, the larger the point, the greater the volume of the offer. The brighter the color, the more offers are concentrated in that location.